At VMworld I ran a few sessions on Day-2 Operations which I also covered the new built in dashboards for vROPS which were introduced with the fully baked HTML5 client in vSAN/vSphere 6.7. Many people were not aware of the dashboards and moreso were not aware that these vSAN specific dashboards continue to work even after the 90 day trial period has expired. Not only that but VMware has done a great job in automating a deployment of vROPS if you have not already got an appliance deployed. So let’s take a look at these new dashboards in a bit more detail.
Firstly the three vSphere operations Dashboards, the default one that loads up is an overview dashboard of all your clusters: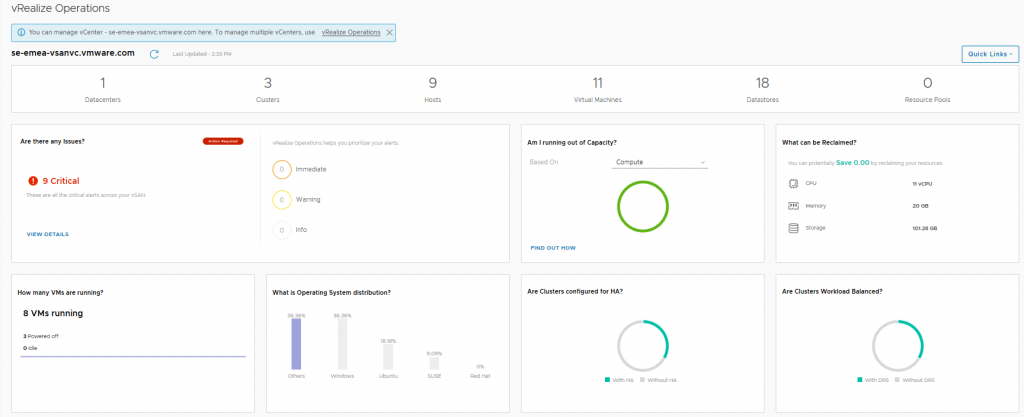
Then there is the Cluster Level View where you pick a specific cluster: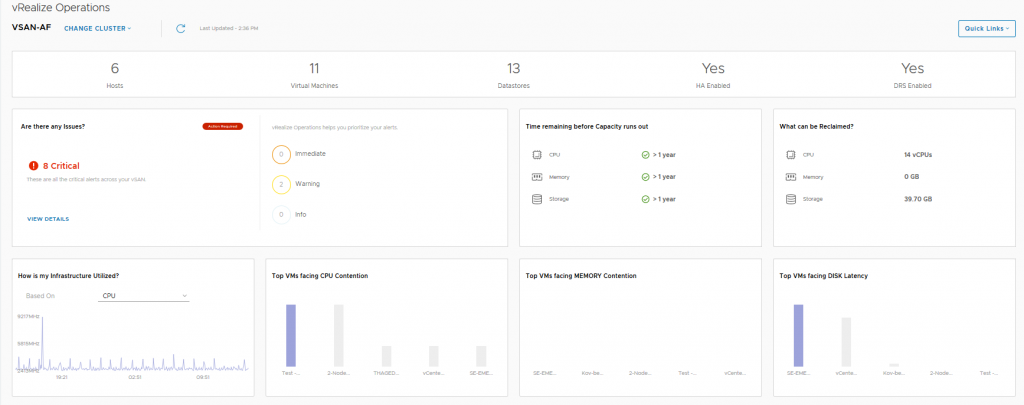
And finally is the Alerts view…Great timing, I have a physical disk failure in the vSAN Cluster: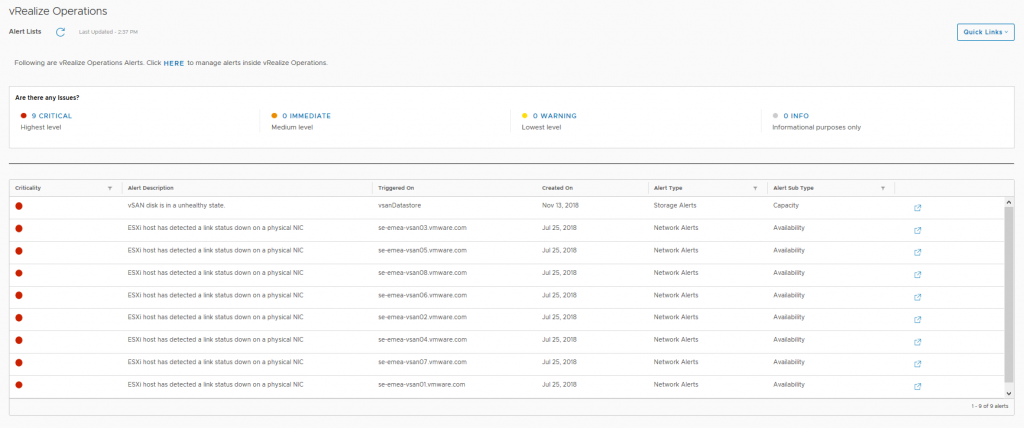 Now the above three dashboards will no longer be available after the 90 day trial period has expired, and also the link to the vRealize Operations appliance will not be functional either, but after the 90 day trial period has expired, the following three vSAN Dashboards will still be fully functional and available, so let’s look at those in a bit more detail:
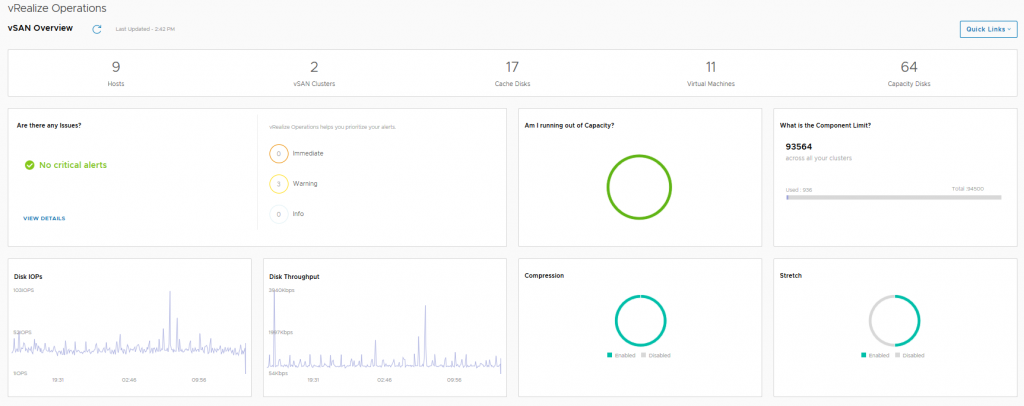 The vSAN Overview dashboard, like the vSphere overview dashboard, displays information at a holistic level for all of your vSAN Clusters within this particular vCenter server, you will see that the dashboard provides information on how many clusters are running dedupe/compression, or how many of the clusters are a Stretched Cluster for example. The dashboard also shows if you need to investigate any current alerts (yes I cleaned up the failed disk before grabbing this screenshot).
The next dashboard we choose a specific cluster to look at in more detail:
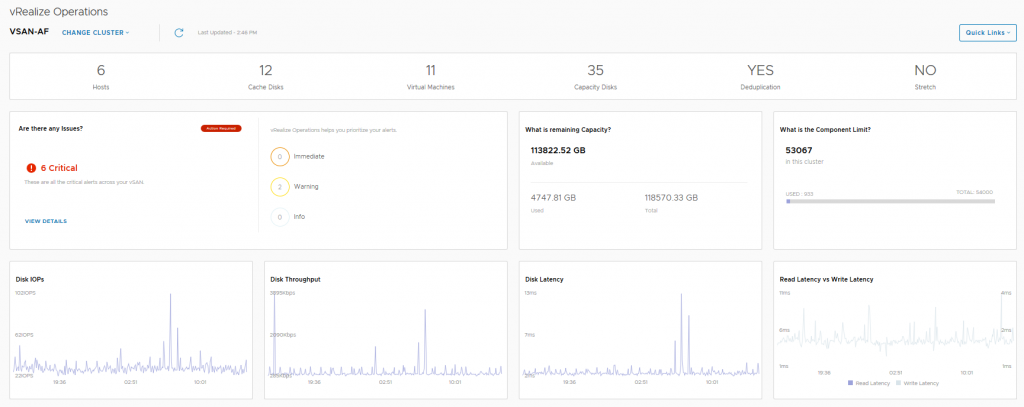 In this dashboard we see information pertaining to a specific cluster, we can see that I have 6 critical alerts which we will take a look at next, but there are some key metrics here that from an operational perspective are pretty important from a day-2 operations standpoint:
- Remaining Capacity
- Component Limit
- IOPS, Throughput and Latency statistics
- Read versus Write latency
The last dashboard is alerts:
 Here we can see the current alerts that have been triggered for each cluster which may need to be addressed, the critical alerts previously highlighted in the cluster view were all related to a network redundancy lost when I was troubleshooting packet loss on the physical switch.
So as you can see there’s a really good amount of detail in the vSphere UI relating to vROPS making the day-2 operations a lot easier to perform.
