Tag Archives: Compression

Day-2 Operations – vSphere built in vROPS dashboards

At VMworld I ran a few sessions on Day-2 Operations which I also covered the new built in dashboards for vROPS which were introduced with the fully baked HTML5 client in vSAN/vSphere 6.7.  Many people were not aware of the dashboards and moreso were not aware that these vSAN specific dashboards continue to work even after the 90 day trial period has expired.  Not only that but VMware has done a great job in automating a deployment of vROPS if you have not already got an appliance deployed.  So let’s take a look at these new dashboards in a bit more detail.

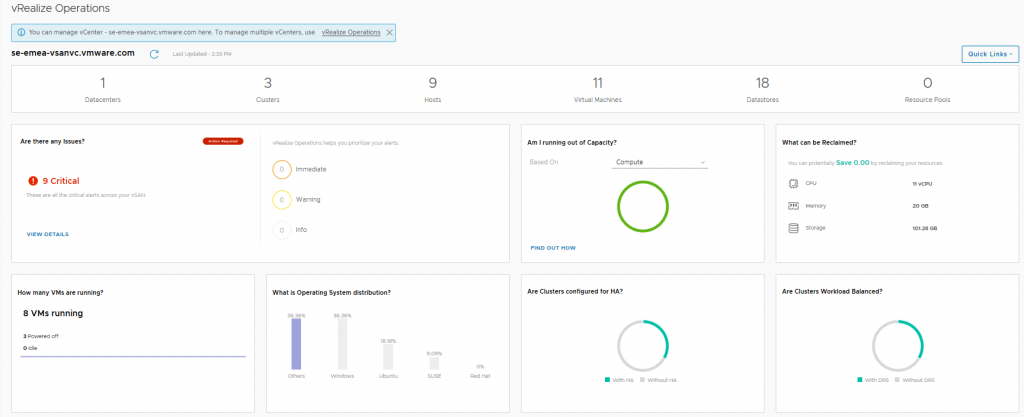
Firstly the three vSphere operations Dashboards, the default one that loads up is an overview dashboard of all your clusters:
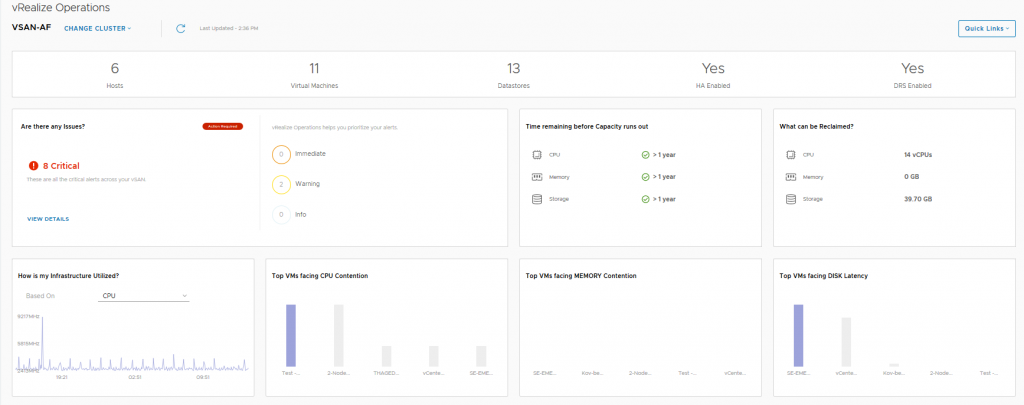
Then there is the Cluster Level View where you pick a specific cluster:
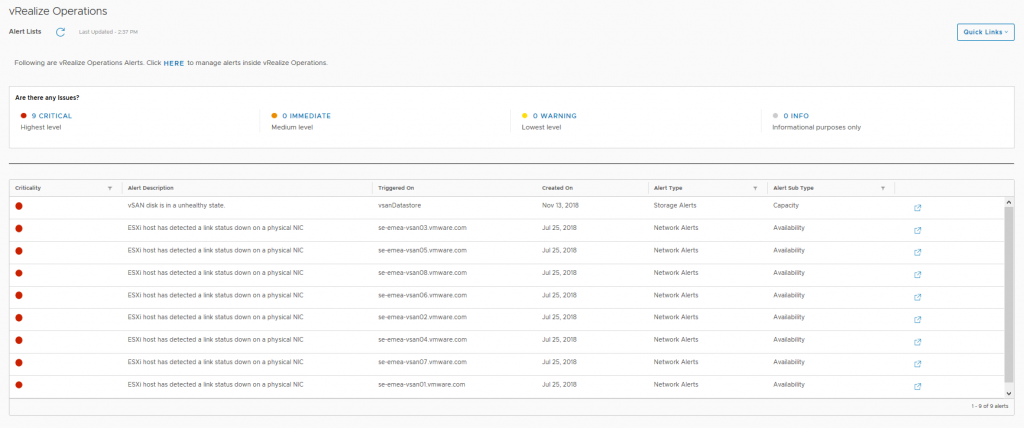
And finally is the Alerts view…Great timing, I have a physical disk failure in the vSAN Cluster:Now the above three dashboards will no longer be available after the 90 day trial period has expired, and also the link to the vRealize Operations appliance will not be functional either, but after the 90 day trial period has expired, the following three vSAN Dashboards will still be fully functional and available, so let’s look at those in a bit more detail:
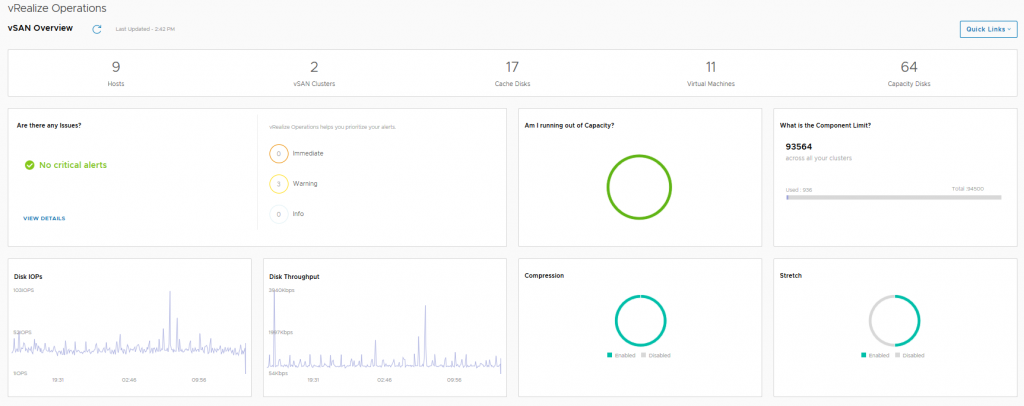
The vSAN Overview dashboard, like the vSphere overview dashboard, displays information at a holistic level for all of your vSAN Clusters within this particular vCenter server, you will see that the dashboard provides information on how many clusters are running dedupe/compression, or how many of the clusters are a Stretched Cluster for example.  The dashboard also shows if you need to investigate any current alerts (yes I cleaned up the failed disk before grabbing this screenshot).

The next dashboard we choose a specific cluster to look at in more detail:
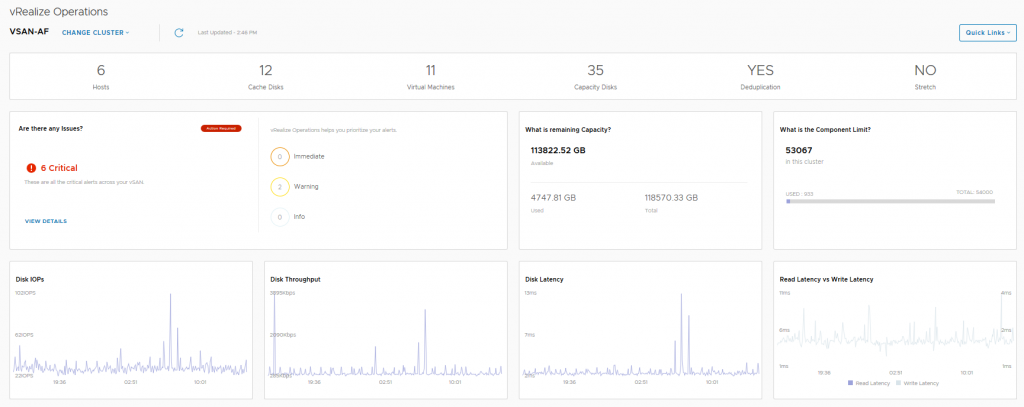
In this dashboard we see information pertaining to a specific cluster, we can see that I have 6 critical alerts which we will take a look at next, but there are some key metrics here that from an operational perspective are pretty important from a day-2 operations standpoint:

  • Remaining Capacity
  • Component Limit
  • IOPS, Throughput and Latency statistics
  • Read versus Write latency

The last dashboard is alerts:
Here we can see the current alerts that have been triggered for each cluster which may need to be addressed, the critical alerts previously highlighted in the cluster view were all related to a network redundancy lost when I was troubleshooting packet loss on the physical switch.

So as you can see there’s a really good amount of detail in the vSphere UI relating to vROPS making the day-2 operations a lot easier to perform.



Day-2 Operations – Capacity Reporting

One of the challenges in storage history is being able to see what exactly is consuming the capacity on a particular datastore, even in my VMware Support days asking the question to a customer would result in a response of “I don’t know exactly”.  This all changed with vSAN, it was recognize that providing a bit more granularity about what exactly is consuming the space on my datastore can offer some really good insights and explanations to the question “Where has my space gone?”

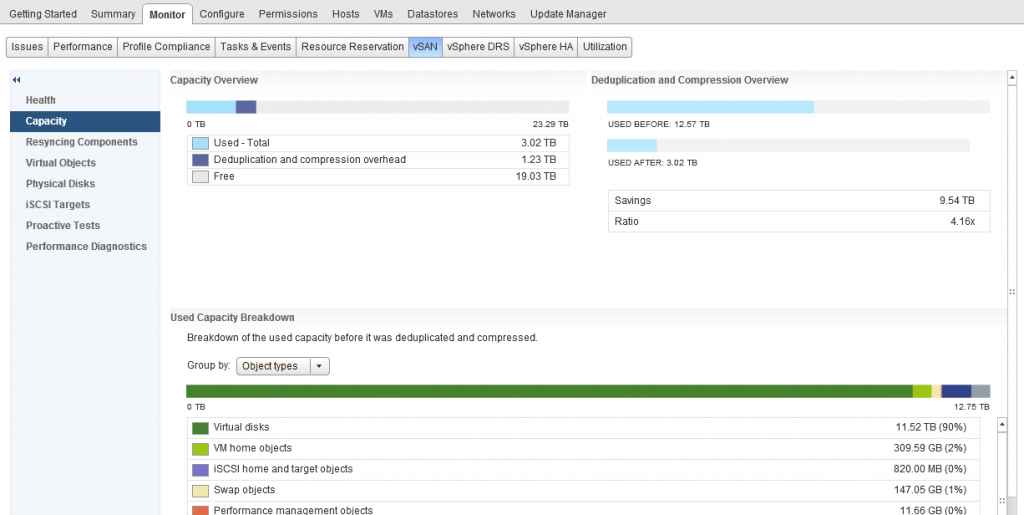
Built into the standard UI for vSphere/vSAN, located under the Monitor/vSAN section is a screen called “Capacity”, and just like the title, it does exactly that, it reports on your capacity as well as giving a breakdown as to what is using the capacity, before we talk about that a bit further, let’s start with the basic fundamental requirements of capacity reporting and that is:

  1. What capacity do I have in total?
  2. What capacity have I used?
  3. What capacity have I got free?
  4. What space savings have I got with dedupe/Compression?

One thing I want to call out which is a question I get asked pretty much most of the time and it is the “Deduplication and Compression overhead” value, as you can see from the above screenshot, in my cluster this is 1.23TB of space, now if you do the math you can work out that this is around 5% of my datastore capacity.  This value will not change as my dedupe/compression ratio increases or decreases.  The only time this value will increase is if I add more capacity (by adding more disks with new disk groups) as the value is around 5% of the overall datastore capacity.

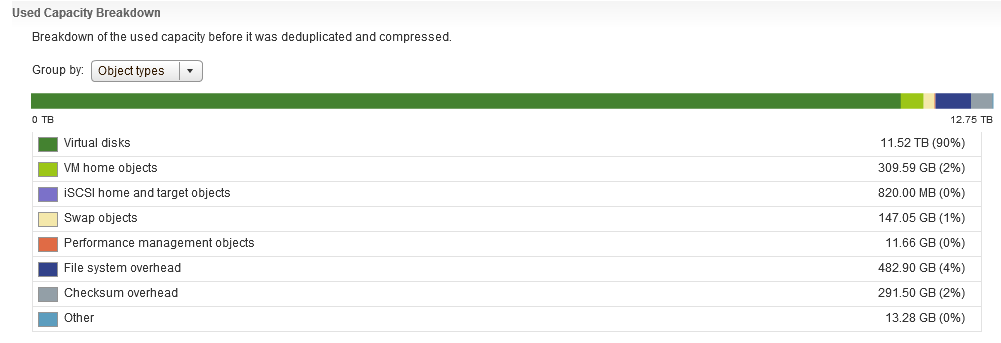
As you can see from the above screenshot the UI answers the fundamental questions right away without any question, but what if your datastore is pretty full and your boss comes over to you and asks you to give them some detail about what is consuming the space?  Well further down the screen is a bit more detail as to the breakdown of consumption:

As you can clearly see there’s a pretty detailed list of consumers for my vSAN datastore, and as an extra bonus, when you hover over an item, it gives a bit more detail about what exactly counts as part of that item, if you take “Other” for example:

One thing that you will immediately notice here is that there is no category for Snapshots, now I remember in my support days, Snapshots were any administrators nightmare, especially when you have inadvertently ran your Exchange server on snapshots for almost 12 months without knowing, so in my opinion that is some important detail that is missing here and that feedback has been provided.
Capacity Reporting in vRealize Operations
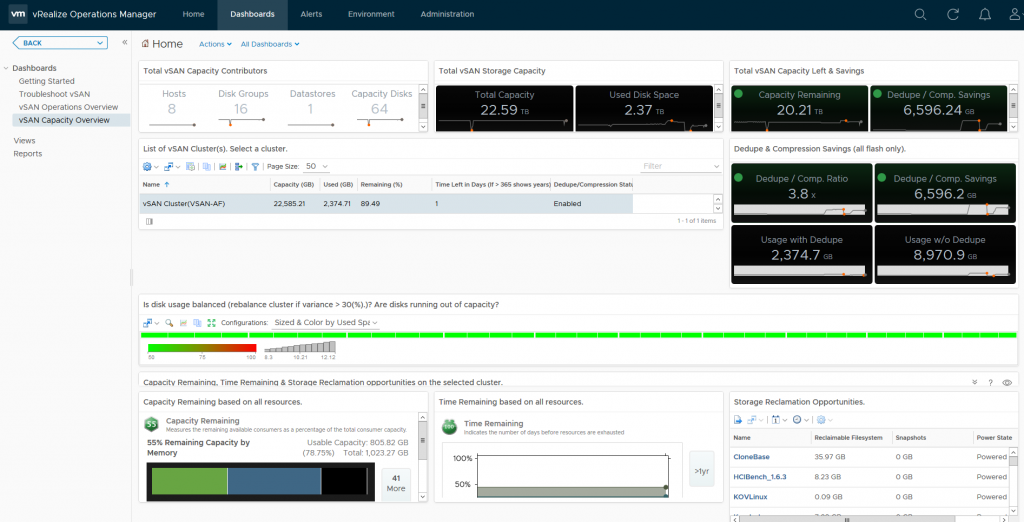
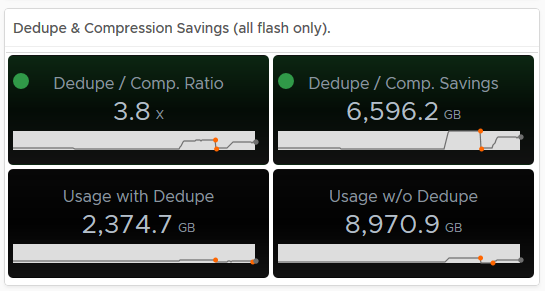
Now vROPS doesn’t go into the level of detail about what exactly is consuming the space on the vSAN Datastore but it offers another insight as to capacity usage.  Unlike the capacity reporting screen within the vSphere UI for vSAN which only provides a point in time view of your capacity, vROPS gives you historical data, lets firstly take a look at what the dashboard looks like:

As you can see, the default Capacity Overview Dashboard for vSAN within vROPS has a wealth of information, we can immediately see the dedupe/compression ratio, free capacity, heatmaps on the disks within the cluster, a unique feature vROPS has over the standard capacity UI in vSphere is that it shows you historical data, for example if we take the dedupe/Compression ratio, as you can see in the example it is 3.8x, but the graph below the value shows you how it has changed over time:

Hovering over an area of the graph will provide you an extract of the value at that point in time:
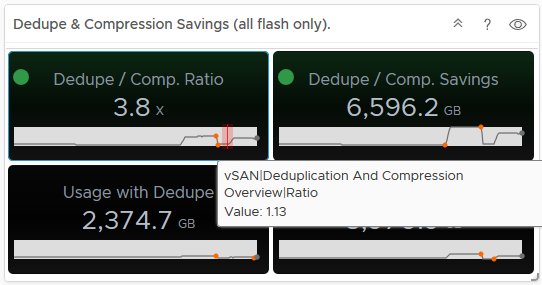
As you can see from the above, my dedupe/Compression dropped to 1.13, now if you tie this into the Used Disk Space screen, you can see that the usage dropped at the same time, indicating a lot of data was deleted (and it actually was on purpose):
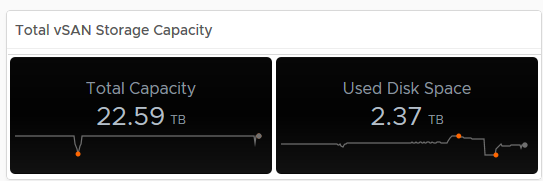
In my opinion having this data is pretty important, especially if the cluster is ingesting data and you want to see historically if this is affecting your dedupe/compression ratio for example.
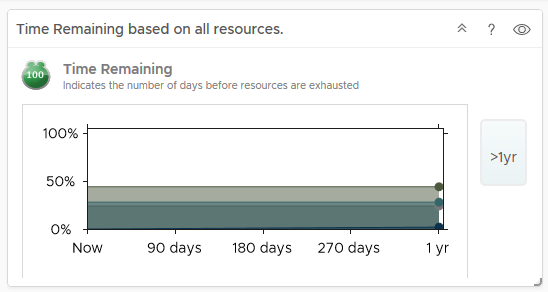
Another unique feature in vRops is the ability to predict when you will run out of resources, now obviously this data is collected over time, so if you deploy out a couple of hundred VMs within a couple of days after deployment, vROPS will tell you that you’re going to run out of space within a few days, but as vROPS gathers statistics after the deployment and learns how quickly VMs grow and your usual deployment/delete cycles, it is pretty accurate at predicting resource exhaustion giving you enough time to plan and cater for adding more resources, my cluster says I have over a year before I run out of resources:

Conclusion:
When it comes to capacity reporting, the native vSAN/vSphere UI provides you with where you are right now and provides you a detailed breakdown as to your vSAN Datastore Consumption, but if you want historical capacity data and trending to predict when you need to add more resources, then vROPS is key, if you arm yourself with both then you have more or less everything you need to provide high levels of detail around your vSAN Capacity.


Sizing for your workloads

When sizing a vSAN environment there are many considerations to take into account, and with the launch of the new vSAN Sizing tool I thought I would take time and write up what questions I commonly ask people in order to get an understanding of what they want to run on vSAN as well as a scope of requirements that meet that workload.

Capacity
Obviously capacity is going to be our baseline for any sizing activity, no matter what we achieve with the other requirements, we have to meet a usable capacity, remember we should always work off a usable capacity for any sizing, a RAW capacity does not take into account any Failure Tolerance Methodology, Erasure Coding or Dedupe/Compression, this is something we will cover a bit later in this article.

Capacity should also include the required Swap File space for each of the VMs that the environment is being scoped for.

IOPS
I have been involved in many discussions where it is totally unknown what the performance requirements are going to be, so many times I have been told “We want the fastest performance possible” without being told what the current IOPS requirement is, to put it into context what is the point in buying a 200mph sports car when the requirement is to drive at 70mph max!

IOPS requirement plays a key part in determining what level of vSAN Ready Node specification is required, for example if a total IOPS requirement is 300,000 IOPS out of a 10 Node cluster, is there much point spending more money on an All-Flash configuration that delivers 150,000 IOPS Per node?  Simple answer…No!  You could opt for a lower vSAN All-Flash Ready Node config that meets the requirements a lot closer and still offer
room for expansion in the future.

Workload Type
This is a pretty important requirement, for example if your workload is more of a write intensive workload then this would change the cache requirements, it may also require a more write intensive flash technology such as NVMe for example.  If you have different workload types going onto the same cluster it would be worthwhile categorizing those workloads into four categories:-

  • 70/30 Read/Write
  • 80/20 Read/Write
  • 90/10 Read/Write
  • 50/50 Read/Write

Having the VMs in categories will allow you to specify the workload types in the sizing tool (in the advanced options).

vCPU to Physical Core count
This is something that gets overlooked not from a requirement perspective, but people are so used to sizing based on a “VM Per Host” scenario which with the increasing CPU core counts does not fit that model any more, even the new sizing tool bases it on vCPU to Physical Core ratio which makes things a lot easier, most customers I Talk to who are performing a refresh of servers with either 12 or 14 core processors can lower the amount of servers required by increasing the core count on the new servers, thus allowing you to run more vCPUs on a single host.

List of questions for requirements for each workload type

  • Average VMDK Size per VM
  • Average number of VMDKs per VM
  • Average number of vCPU per VM
  • Average vRAM per VM
  • Average IOPS Requirement per VM
  • Number of VMs
  • vCPU to Physical Core Ratio

RAW Capacity versus Usable Capacity, how much do I actually need?
The new sizing tool takes all your requirements into account, even the RAID levels, Dedupe/Compression ratios etc and returns with a RAW Capacity requirement based on the data you enter, if you are like me and prefer to do it quick and dirty, below is table showing you how to work out based on a requirement of 100TB of usable (Including Swap File Space), based on a standard cluster with no stretched capacilities it looks like this:

FTT LevelFTT MethodMin number of hostsMultiplication FactorRAW Capacity Based on 100TB Usable
FTT=0NoneN/A1x100TB
FTT=1Mirror32x200TB
FTT=2Mirror53x300TB
FTT=3Mirror74x400TB
FTT=1RAID541.33x133TB
FTT=2RAID661.5x150TB

Now in vSAN 6.6 VMware introduced localized protection (Secondary FTT) and the ability to include or not include specific objects from the stretched cluster (Primary FTT), below is a table showing what the RAW Capacity requirements are based on the two FTT levels

Primary FTT LevelSecondary FTT LevelSecondary FTT MethodMin Number of hosts per siteRAW Capacity Based on 100TB Usable
PFTT=1SFTT=0RAID01200TB
PFTT=1SFTT=1RAID13400TB
PFTT=1SFTT=1RAID54266TB
PFTT=1SFTT=2RAID66300TB

Mixed FTT levels and FTT Methods
Because vSAN is truly a Software Defined Storage Platform, this means that you can have a mixture of VMs/Objects with varying levels of protection and FTT Methods, for example for Read intensive workloads you may choose to have RAID 5 in the storage policy, and for more write intensive workloads a RAID 1 policy, they can all co-exist on the same vSAN Cluster/Datastore perfectly well, and the new sizing tool allows you to specify different Protection Levels and Methods for each workload type.