Tag Archives: Read Cache

Day-2 Operations – Performance Monitoring in the vSAN UI

Performance reporting or Performance Monitoring is something of a must in any storage environment today, I remember many times when I was in VMware Support when facing a customer storage performance issue that metrics were not there to capture the event, and most storage performance tools required enabling, obviously this meant that the issue had to be occurring at the time of the performance metrics grab, vSAN in the early days was no different, vSAN Observer whilst being a detailed tool and provided a lot of information, was not a historical tool, it was enabled to troubleshoot a performance issue that was happening at that particular time.

In the later releases of vSAN the UI came equipped with more performance metrics than you could shake a stick at, which from a performance troubleshooting and monitoring perspective is the dogs danglies, but what does this mean from an every day perspective?  Before we take a look at the UI, there are three areas where vSAN Performance metrics can be displayed

  • Cluster level – This is the performance metrics aggregated for the whole cluster and allow you to have the high level view of how your cluster is performing as a whole
  • Host Level – This allows you to look at how vSAN is performing on a host by host perspective and contains further information drilling down through things like Disk Groups, Physical Disks, Network Controllers, VMkernel interfaces.
  • VM Level – This focuses on a specific virtual machine and the objects associated with it.

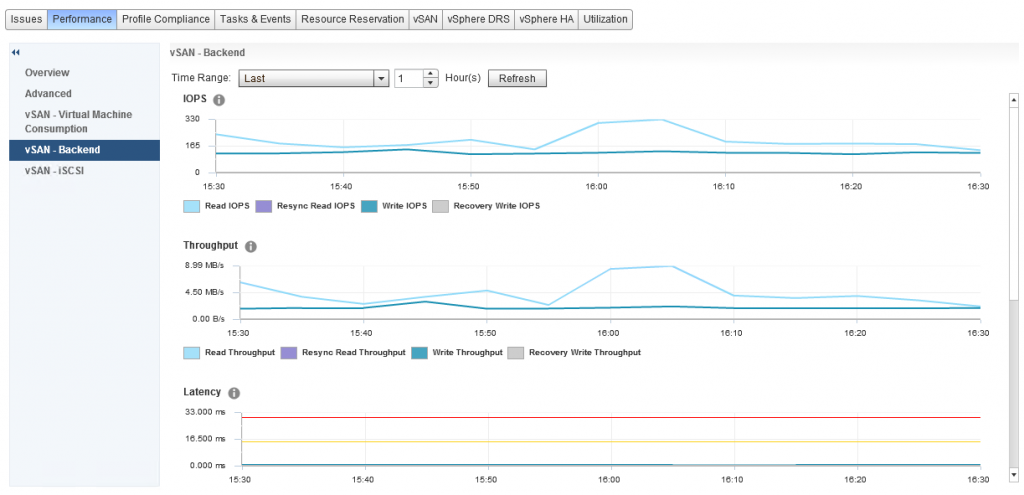
So what information do we have exactly for a given observation level?  Well let’s first of all take a look at the cluster level performance information, there are three options under the performance tab for vSAN

  • vSAN – Virtual Machine Consumption
  • vSAN – Backend
  • vSAN – iSCSI

I have met many customers that immediately notice there is a big difference between the Virtual Machine Consumption and the Backend graphs, so before we go any further let’s talk about what each of these specific areas mean.

Virtual Machine Consumption
These graphs represent the values that objects residing on the vSAN Datastore are seeing, now remember everything that exists on vSAN is an object, so consumers that are counted in these graphs are Virtual Machines, Stats Objects etc

Backend
These graphs represent the backend disks associated with vSAN, cache and capacity

Both sets of graphs cover the statistics for:

  • IOPS
  • Throughput
  • Latency
  • Congestion
  • Outstanding I/O

iSCSI
The iSCSI Performance graphs contain all the graphs above with the exception of Congestion, these graphs are in relation to each iSCSI Target/LUN created and each one is selected in turn to review the performance graphs associated.

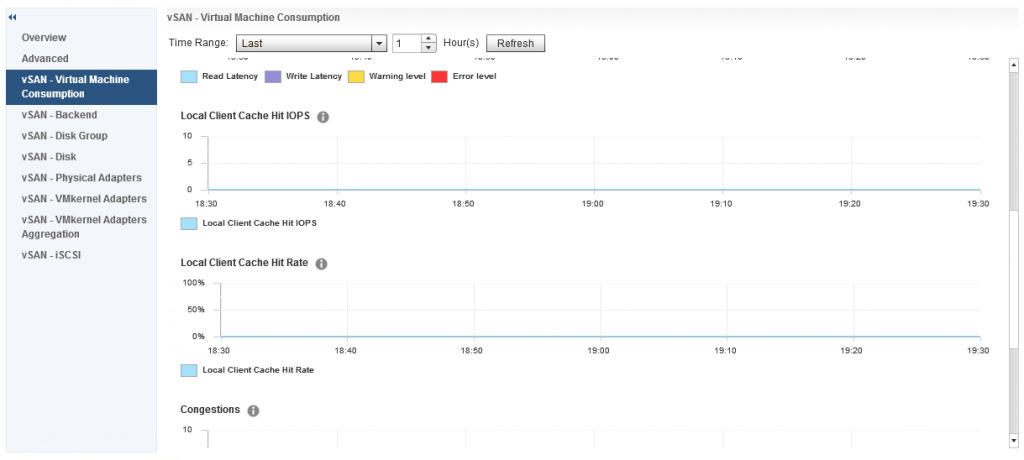
If we move our focus to a host level, in here we have a number of options in addition to the three we also see at a cluster level, however there is some additional metrics we get at a host level for Virtual Machine Consumption and Backend, in the Virtual Machine Consumption graph we have Local Client Cache Hit IOPS and Local Client Cache Hit Rate
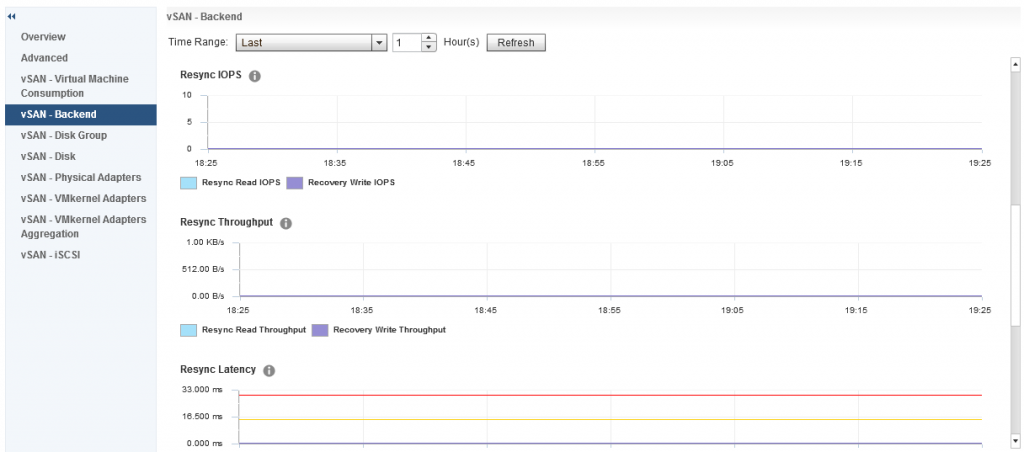
And under Backend we also have some additional graphs for Resync IOPS, Resync Throughput and Resync LatencyThe resync metrics are extremely important if vSAN is recovering from a failure of some sort and performing a resync of degraded components, it is also important if you are performing a pro-active rebalance, policy change or a full data migration during host or disk/diskgroup evacuation.
The other options listed under host vSAN performance are:

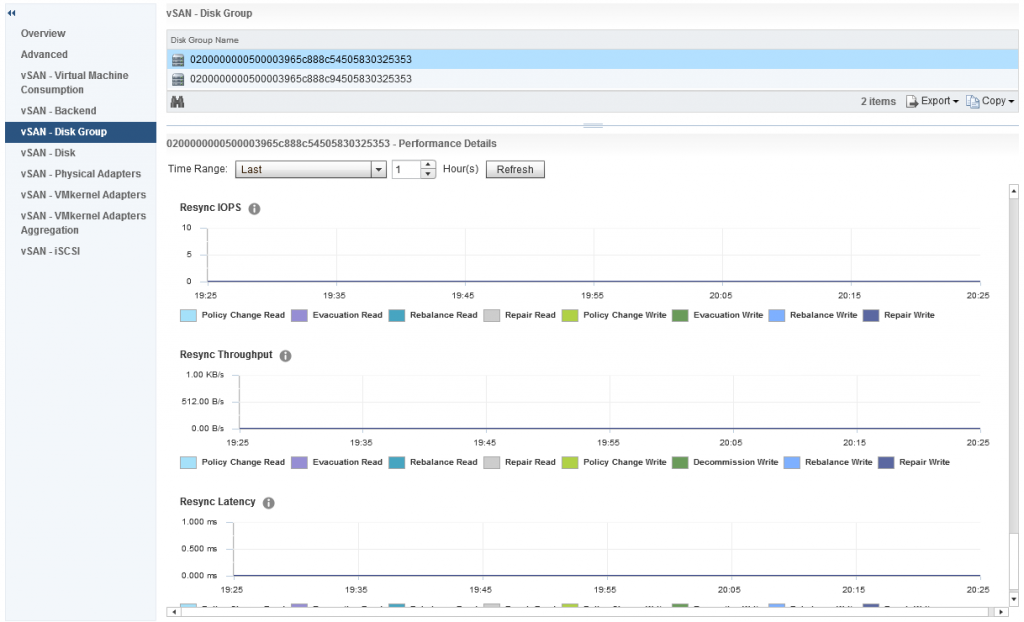
  • Disk Group – Shows the performance graphs for the disk groups, I will cover this below as this is one of the most interesting set of metrics with a lot of detail.
  • Disk – Shows the physical disks in the host reporting on IOPS, Throughput and  Latency
  • Physical Adapters – Shows the network stats for each vmnic associated with vSAN, stats include Packet Loss Rate which is good for troubleshooting networking issues
  • VMkernel Adapters – Shows the statistics for each VMkernel configured for vSAN, this also includes a Packet Loss Rate which you can then use to troubleshoot the software network stack
  • VMkernel Adapters Aggregation – This is an aggregation of all VMkernel interfaces being used for vSAN on the host

Now let’s go back to the Disk Group performance graphs, as I said earlier this is a very interesting group of metrics to explore, so what do we have in this group?  The first section is all about Frontend (Guest) IOPS, Throughput and Latency
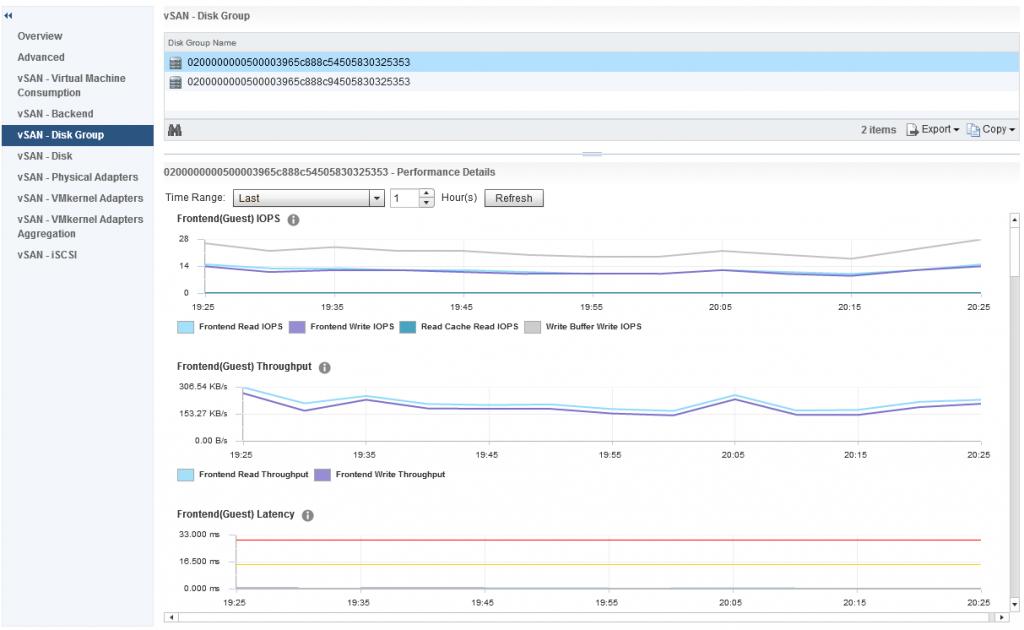
The frontend statistics are maybe as you have guessed already, they are related to vSAN Object I/O being generated from guests running within the vSAN cluster.  If we scroll down a little further we can see statistics relating to Overhead IO,  Read Cache Hit Rate (for hybrid) and Evictions:
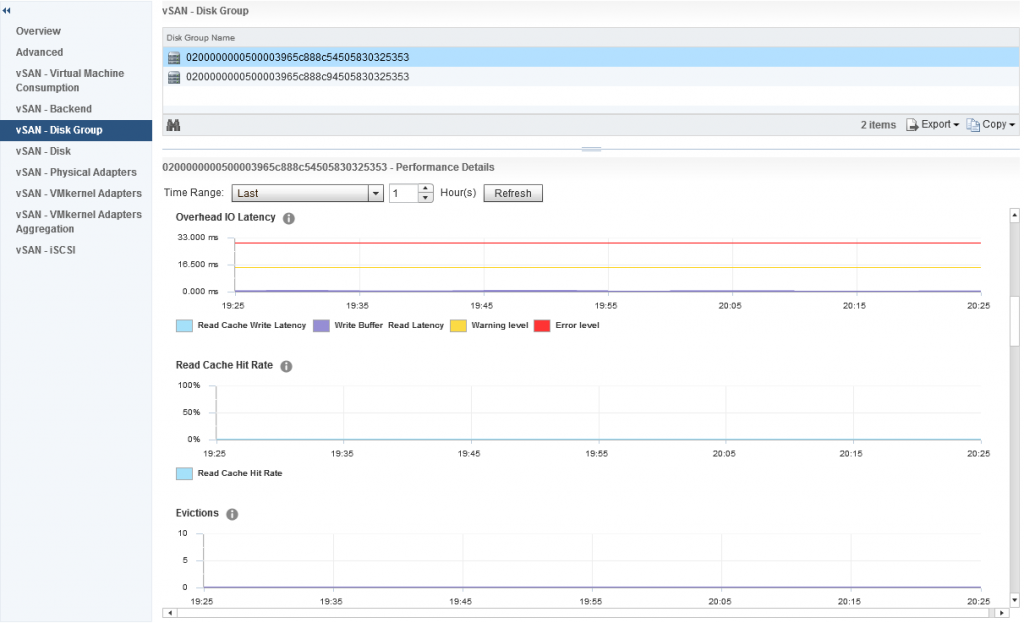
Further down we have statistics relating to the vSAN Write Buffer and De-stage rate clearly showing how much of the write buffer is free and also how quickly data is being de-staged from cache to capacity, now we also have resync metrics under disk groups, however this differs slightly against the Cluster Wide Backend statistics, in the disk group graphs we actually have values that represent various aspects of the Resync Operations, the graph differentiates between:

  • Policy Changes
  • Repairs
  • Rebalance

So you can easily distinguish what resync operations are happening by the statistics within the disk group stats.

Collection Interval
The vSAN Performance metrics collect the sample every five minutes, and this is an average over that five minute period, if your cluster is hardly doing anything (like my cluster for the screenshots) then this can throw out some of the latency numbers, in my own cluster I have noticed it shows higher latency when doing practically nothing than it does when I start putting load on the cluster.  I have spoken to many customers about this, it is no concern, it just means that during the collection sample maybe a few “Large” IO operations returned a larger Latency and because of the low number of samples, this skews the average, so no cause for alarm on that one.

Up next will be Day-2 Operations, Performance Monitoring with vROPS, I just have to write it first 🙂

Sizing for your workloads

When sizing a vSAN environment there are many considerations to take into account, and with the launch of the new vSAN Sizing tool I thought I would take time and write up what questions I commonly ask people in order to get an understanding of what they want to run on vSAN as well as a scope of requirements that meet that workload.

Capacity
Obviously capacity is going to be our baseline for any sizing activity, no matter what we achieve with the other requirements, we have to meet a usable capacity, remember we should always work off a usable capacity for any sizing, a RAW capacity does not take into account any Failure Tolerance Methodology, Erasure Coding or Dedupe/Compression, this is something we will cover a bit later in this article.

Capacity should also include the required Swap File space for each of the VMs that the environment is being scoped for.

IOPS
I have been involved in many discussions where it is totally unknown what the performance requirements are going to be, so many times I have been told “We want the fastest performance possible” without being told what the current IOPS requirement is, to put it into context what is the point in buying a 200mph sports car when the requirement is to drive at 70mph max!

IOPS requirement plays a key part in determining what level of vSAN Ready Node specification is required, for example if a total IOPS requirement is 300,000 IOPS out of a 10 Node cluster, is there much point spending more money on an All-Flash configuration that delivers 150,000 IOPS Per node?  Simple answer…No!  You could opt for a lower vSAN All-Flash Ready Node config that meets the requirements a lot closer and still offer
room for expansion in the future.

Workload Type
This is a pretty important requirement, for example if your workload is more of a write intensive workload then this would change the cache requirements, it may also require a more write intensive flash technology such as NVMe for example.  If you have different workload types going onto the same cluster it would be worthwhile categorizing those workloads into four categories:-

  • 70/30 Read/Write
  • 80/20 Read/Write
  • 90/10 Read/Write
  • 50/50 Read/Write

Having the VMs in categories will allow you to specify the workload types in the sizing tool (in the advanced options).

vCPU to Physical Core count
This is something that gets overlooked not from a requirement perspective, but people are so used to sizing based on a “VM Per Host” scenario which with the increasing CPU core counts does not fit that model any more, even the new sizing tool bases it on vCPU to Physical Core ratio which makes things a lot easier, most customers I Talk to who are performing a refresh of servers with either 12 or 14 core processors can lower the amount of servers required by increasing the core count on the new servers, thus allowing you to run more vCPUs on a single host.

List of questions for requirements for each workload type

  • Average VMDK Size per VM
  • Average number of VMDKs per VM
  • Average number of vCPU per VM
  • Average vRAM per VM
  • Average IOPS Requirement per VM
  • Number of VMs
  • vCPU to Physical Core Ratio

RAW Capacity versus Usable Capacity, how much do I actually need?
The new sizing tool takes all your requirements into account, even the RAID levels, Dedupe/Compression ratios etc and returns with a RAW Capacity requirement based on the data you enter, if you are like me and prefer to do it quick and dirty, below is table showing you how to work out based on a requirement of 100TB of usable (Including Swap File Space), based on a standard cluster with no stretched capacilities it looks like this:

FTT LevelFTT MethodMin number of hostsMultiplication FactorRAW Capacity Based on 100TB Usable
FTT=0NoneN/A1x100TB
FTT=1Mirror32x200TB
FTT=2Mirror53x300TB
FTT=3Mirror74x400TB
FTT=1RAID541.33x133TB
FTT=2RAID661.5x150TB

Now in vSAN 6.6 VMware introduced localized protection (Secondary FTT) and the ability to include or not include specific objects from the stretched cluster (Primary FTT), below is a table showing what the RAW Capacity requirements are based on the two FTT levels

Primary FTT LevelSecondary FTT LevelSecondary FTT MethodMin Number of hosts per siteRAW Capacity Based on 100TB Usable
PFTT=1SFTT=0RAID01200TB
PFTT=1SFTT=1RAID13400TB
PFTT=1SFTT=1RAID54266TB
PFTT=1SFTT=2RAID66300TB

Mixed FTT levels and FTT Methods
Because vSAN is truly a Software Defined Storage Platform, this means that you can have a mixture of VMs/Objects with varying levels of protection and FTT Methods, for example for Read intensive workloads you may choose to have RAID 5 in the storage policy, and for more write intensive workloads a RAID 1 policy, they can all co-exist on the same vSAN Cluster/Datastore perfectly well, and the new sizing tool allows you to specify different Protection Levels and Methods for each workload type.


Cache Sizing

Since vSAN was released in 2014 there has been a bit of confusion as to how much cache should be sized for the cluster, this article is intended to clear that up and provide direction for both Hybrid and All-Flash configurations.? The reason there are differences in the recommendations is primarily because in Hybrid the cache is a Read Cache as well as a Write Buffer and in All-Flash it’s just serving as a Write Buffer, so the sizing is not a “one size fits all”.

Capacity Definitions:

  • RAW Capacity – This is the amount of capacity the vSAN Datastore will provide
  • Usable Capacity – This is the amount of capacity that can be provided based on the FTT level specified in storage policies
  • Provisioned / Deployed Capacity – This is the amount of space taken by objects before FTT is taken into account
  • Consumed Capacity – This is the amount of space that has been consumed by objects taking into account FTT, for example a 100GB Object with FTT=1 will consume 200GB of storage space


Hybrid Cache Sizing
In Hybrid the recommendation has always been 10% of Usable Capacity or Deployed capacity, if we have a 3-Node vSAN cluster, each host has two disk groups and each disk group has 7×1.2TB 10K SAS Drives, that means each host has 16.8TB of RAW Capacity and our 3-Node cluster has 50.4TB of RAW Capacity, based on the following FTT Values in our storage policy this means our total Usable Capacity is:

FTT=0 – 50.4TB
FTT=1 – 25.2TB
FTT=2 – 16.8TB
FTT=3 – 12.6TB

Based on the 10% rule our cache requirements are as follows:

FTT=0 – 5.4TB which equates to 1.8TB Per node which equates to 900GB Per Disk Group
FTT=1 – 2.52TB which equates to 0.84TB Per node which equates to 420GB Per Disk Group
FTT=2 – 1.68TB which equates to 0.56TB Per node which equates to 280GB Per Disk Group
FTT=3 – 1.26TB which equates to 0.42TB Per node which equates to 210GB Per Disk Group

The above sizing is all well and good if you are only using a single FTT method, however vSAN allows you to define policies with different FTT levels which means you can have objects on vSAN that have varying levels of protection, this makes sizing using the above method all the more difficult.

The best way to size the cache in a Hybrid cluster is to base it on your deployed or provisioned capacity, for example in the above RAW capacity of 50.4TB you may choose to have the following as an example

10 Objects based on FTT=0 of 500GB which totals 5TB of Provisioned Capacity and 5TB of Consumed Capacity
10 Objects based on FTT=1 of 500GB which totals 5TB of Provisioned Capacity and 10TB of Consumed Capacty
10 Objects based on FTT=2 of 500GB which totals 5TB of Provisioned Capacity and 15TB of Consumed Capacity
10 Objects based on FTT=3 of 500GB which totals 5TB of Provisioned Capacity and 20TB of Consumed Capacity

If you total up the above, our Provisioned Capacity is 20TB but our Consumed Capacity is 50TB, based on the Provisioned Capacity of 20TB, 10% of this is 2TB which equates to 0.67TB Per Node, or 333GB per Disk Group, this is how your cache in Hybrid should be sized.

All-Flash Cache Sizing
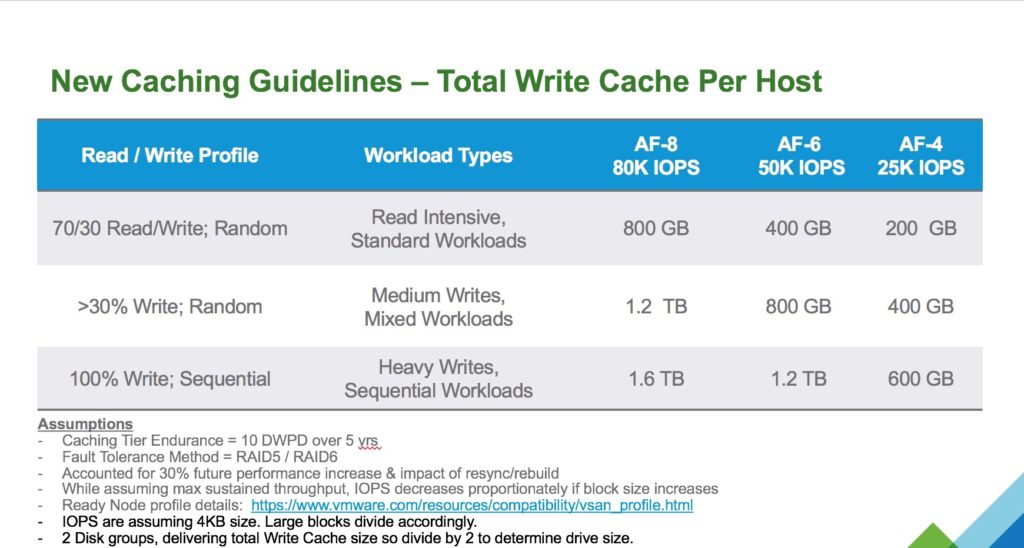
All flash has a lot more factors to consider, Erasure Coding, Dedupe and Compression and the fact that the cache is purely a Write Buffer so we have to take into account write endurance so the usual 10% sizing does not apply here.? In reality the typical 70% Read / 30% Write workload means that a lot of the requests are coming from the Capacity Tier which in this case is flash based anyway, so this means that the cache layer can be much smaller than it would have been in Hybrid for the same RAW capacity, however there is the write endurance factor to take into account.? We all know there is a write buffer limit in vSAN but that does not mean you should limit the size of the SSD drives based on that, the main reason is to increase the endurance of the drive, vSAN will cycle through all the cells on the drive irrelevant of the Write Buffer Limit.? VMware recently published a new sizing guide for All-Flash which is shown below


There we have it!