One of the challenges in storage history is being able to see what exactly is consuming the capacity on a particular datastore, even in my VMware Support days asking the question to a customer would result in a response of “I don’t know exactly”. This all changed with vSAN, it was recognize that providing a bit more granularity about what exactly is consuming the space on my datastore can offer some really good insights and explanations to the question “Where has my space gone?”
Built into the standard UI for vSphere/vSAN, located under the Monitor/vSAN section is a screen called “Capacity”, and just like the title, it does exactly that, it reports on your capacity as well as giving a breakdown as to what is using the capacity, before we talk about that a bit further, let’s start with the basic fundamental requirements of capacity reporting and that is:
- What capacity do I have in total?
- What capacity have I used?
- What capacity have I got free?
- What space savings have I got with dedupe/Compression?
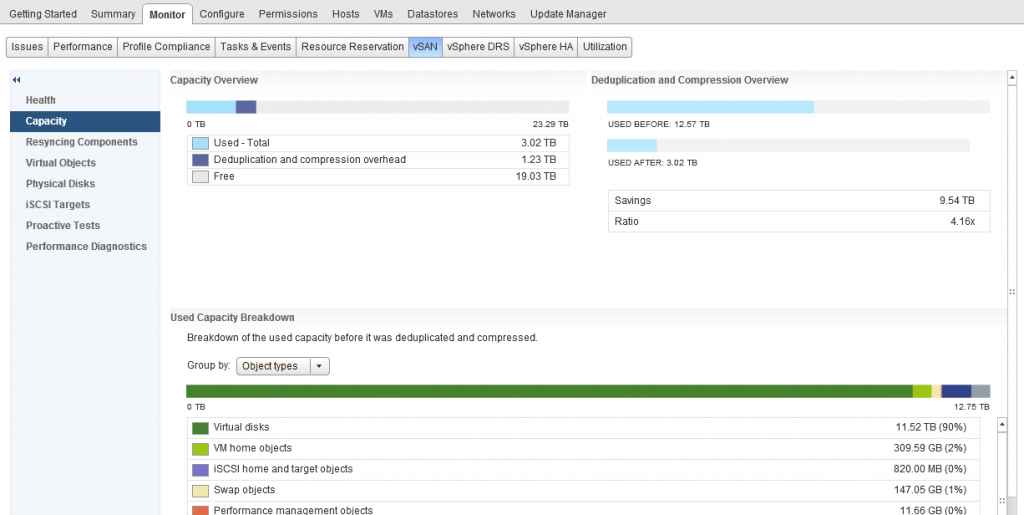
One thing I want to call out which is a question I get asked pretty much most of the time and it is the “Deduplication and Compression overhead” value, as you can see from the above screenshot, in my cluster this is 1.23TB of space, now if you do the math you can work out that this is around 5% of my datastore capacity. This value will not change as my dedupe/compression ratio increases or decreases. The only time this value will increase is if I add more capacity (by adding more disks with new disk groups) as the value is around 5% of the overall datastore capacity.
As you can see from the above screenshot the UI answers the fundamental questions right away without any question, but what if your datastore is pretty full and your boss comes over to you and asks you to give them some detail about what is consuming the space? Well further down the screen is a bit more detail as to the breakdown of consumption:
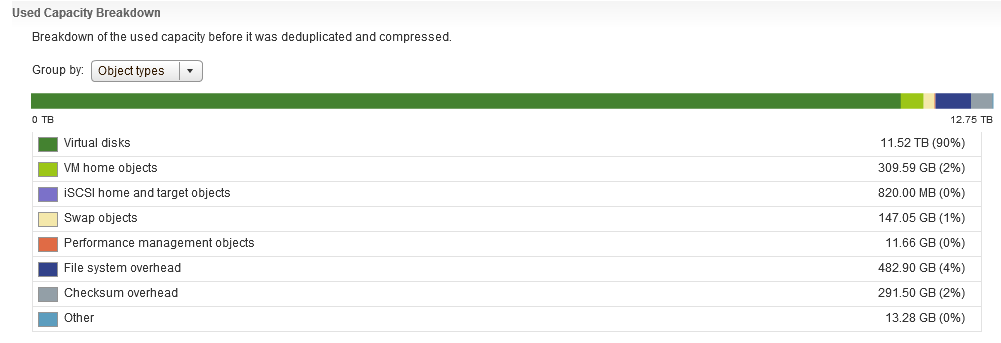 As you can clearly see there’s a pretty detailed list of consumers for my vSAN datastore, and as an extra bonus, when you hover over an item, it gives a bit more detail about what exactly counts as part of that item, if you take “Other” for example:
 One thing that you will immediately notice here is that there is no category for Snapshots, now I remember in my support days, Snapshots were any administrators nightmare, especially when you have inadvertently ran your Exchange server on snapshots for almost 12 months without knowing, so in my opinion that is some important detail that is missing here and that feedback has been provided.
Capacity Reporting in vRealize Operations
Now vROPS doesn’t go into the level of detail about what exactly is consuming the space on the vSAN Datastore but it offers another insight as to capacity usage. Unlike the capacity reporting screen within the vSphere UI for vSAN which only provides a point in time view of your capacity, vROPS gives you historical data, lets firstly take a look at what the dashboard looks like:
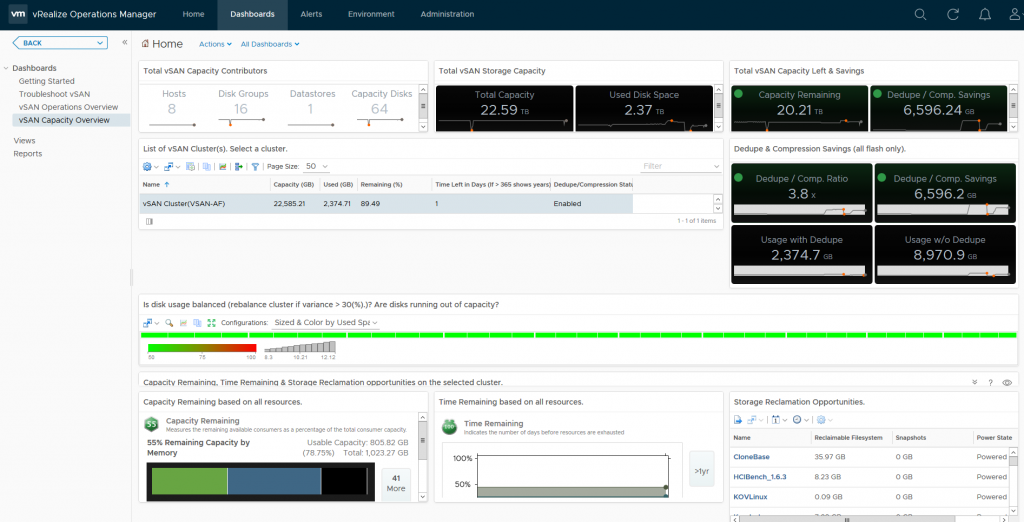 As you can see, the default Capacity Overview Dashboard for vSAN within vROPS has a wealth of information, we can immediately see the dedupe/compression ratio, free capacity, heatmaps on the disks within the cluster, a unique feature vROPS has over the standard capacity UI in vSphere is that it shows you historical data, for example if we take the dedupe/Compression ratio, as you can see in the example it is 3.8x, but the graph below the value shows you how it has changed over time:
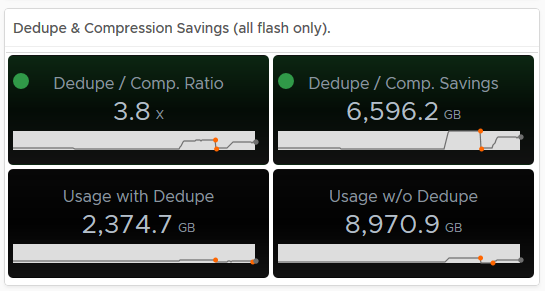 Hovering over an area of the graph will provide you an extract of the value at that point in time:
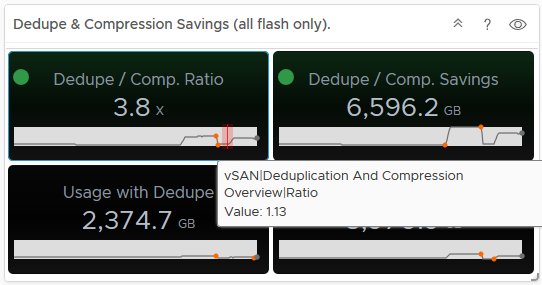 As you can see from the above, my dedupe/Compression dropped to 1.13, now if you tie this into the Used Disk Space screen, you can see that the usage dropped at the same time, indicating a lot of data was deleted (and it actually was on purpose):
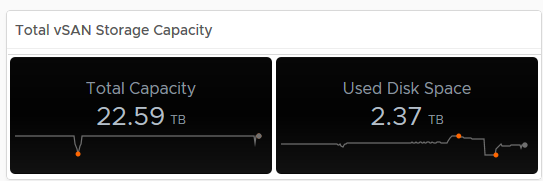 In my opinion having this data is pretty important, especially if the cluster is ingesting data and you want to see historically if this is affecting your dedupe/compression ratio for example.
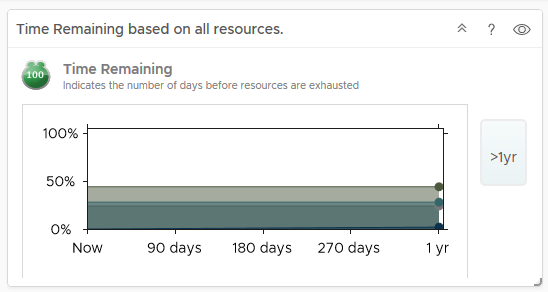
Another unique feature in vRops is the ability to predict when you will run out of resources, now obviously this data is collected over time, so if you deploy out a couple of hundred VMs within a couple of days after deployment, vROPS will tell you that you’re going to run out of space within a few days, but as vROPS gathers statistics after the deployment and learns how quickly VMs grow and your usual deployment/delete cycles, it is pretty accurate at predicting resource exhaustion giving you enough time to plan and cater for adding more resources, my cluster says I have over a year before I run out of resources:
Conclusion:
When it comes to capacity reporting, the native vSAN/vSphere UI provides you with where you are right now and provides you a detailed breakdown as to your vSAN Datastore Consumption, but if you want historical capacity data and trending to predict when you need to add more resources, then vROPS is key, if you arm yourself with both then you have more or less everything you need to provide high levels of detail around your vSAN Capacity.


 One thing that you will immediately notice here is that there is no category for Snapshots, now I remember in my support days, Snapshots were any administrators nightmare, especially when you have inadvertently ran your Exchange server on snapshots for almost 12 months without knowing, so in my opinion that is some important detail that is missing here and that feedback has been provided.
 Hovering over an area of the graph will provide you an extract of the value at that point in time:
 As you can see from the above, my dedupe/Compression dropped to 1.13, now if you tie this into the Used Disk Space screen, you can see that the usage dropped at the same time, indicating a lot of data was deleted (and it actually was on purpose):
 In my opinion having this data is pretty important, especially if the cluster is ingesting data and you want to see historically if this is affecting your dedupe/compression ratio for example.